Practice Management
Days in A/R: The One Metric That Reveals Everything About Your Billing Health


When we benchmark a new practice for Sovereign RCM, I ask for one number before anything else: days in accounts receivable. Not the denial rate, not the collection ratio, not the clean-claim rate. Days in A/R. If a practice tracks only one metric, this is the one I want, because it quietly folds every other part of the revenue cycle into a single figure.
What the Number Actually Measures
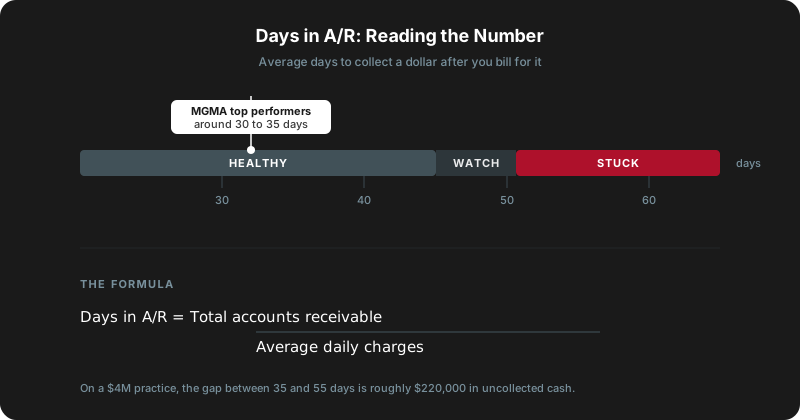
Days in A/R is the average time it takes to collect a dollar after you bill for it. The formula is simple:
Days in A/R = Total accounts receivable / Average daily charges
Average daily charges is your total charges over a period divided by the number of days in that period. Most practices calculate it on a rolling 90-day window to smooth out seasonal swings.
The result is a number of days. MGMA's better-performing practices sit around 30 to 35 days. HFMA treats anything under 40 as healthy. Once a practice crosses 50, money is stuck somewhere in the pipeline, and the gap between 35 and 55 days on a practice billing $4 million a year is roughly $220,000 in cash that should be in the bank and isn't.
Why It Reveals Everything
A denial rate tells you about coding. A charge-lag report tells you about the front desk. Days in A/R tells you about all of it at once, because a dollar can get stuck at any stage of the cycle and every one of those delays lands in the same number.
Slow charge entry pushes it up before a claim ever goes out. Eligibility errors and missing prior authorizations push it up when claims bounce. Undercoded or mis-modified claims push it up through denials and rework. Weak follow-up on aged balances pushes it up at the back end, where underpaid claims sit untouched because nobody has time to appeal a $60 shortfall.
That is the trap. When days in A/R climbs, the instinct is to blame the billers doing collections. Usually the leak started three steps upstream, at intake or at coding, and the collections team is just where the symptom finally shows up.

The Aging Bucket That Matters Most
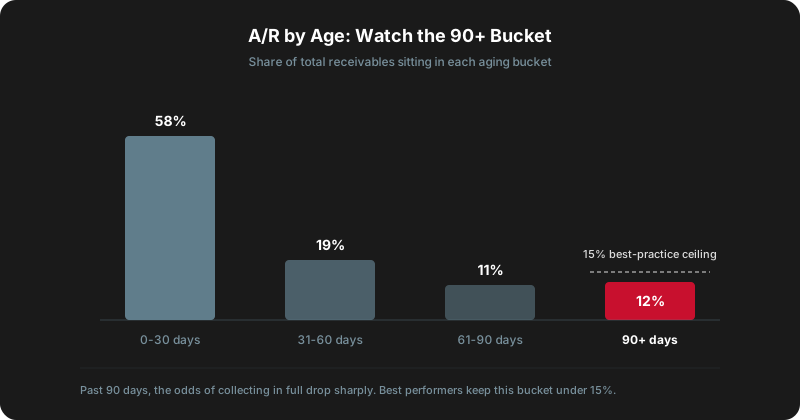
The headline number hides as much as it reveals, so pair it with your A/R aging breakdown: the percentage of receivables sitting in the 0-30, 31-60, 61-90, and 90-plus day buckets.
The 90-plus bucket is the one to watch. Best-performing practices keep it under 15 percent of total A/R. Once a claim ages past 90 days, the odds of collecting it in full drop sharply, and past 120 days many payers will deny on timely-filing grounds no matter how clean the claim was. A practice can post a respectable 38-day average and still be quietly writing off a fat 90-plus bucket, because a pile of fast small payments masks a stack of old large ones.
So read the two together. The average tells you the cycle's overall speed. The aging buckets tell you whether the delay is spread evenly or concentrated in claims that are about to become uncollectible.
What Moves It in the Right Direction
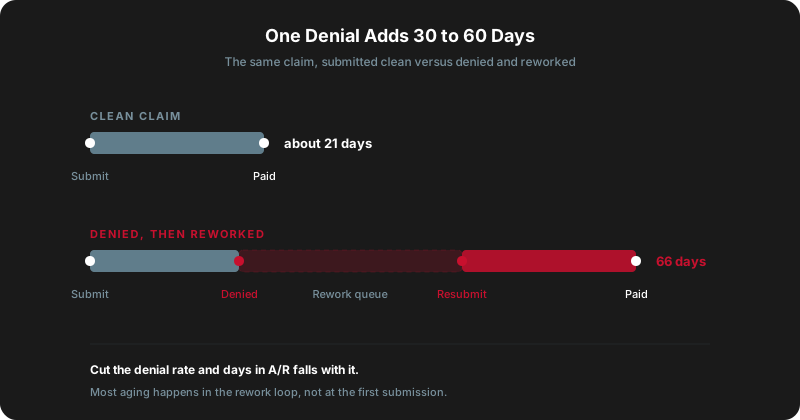
The fastest lever is the one most practices underuse: stop the claims that would have been denied from going out in the first place. Every denial is a claim that ages 30 to 60 extra days while it gets reworked and resubmitted, assuming it gets reworked at all. Cut your denial rate and days in A/R falls with it, because the rework loop is where most of the aging actually happens.
This is one reason we built Sovereign RCM to catch problems before submission rather than after. An AI pipeline that reads the clinical note, checks the codes and modifiers against payer rules, and flags likely denial triggers means fewer claims bounce, fewer claims land in the 90-plus bucket, and the average comes down without anyone chasing a single extra appeal. During our 90-day pilots, days in A/R is one of the metrics we track from the first week, precisely because it moves when the upstream work gets cleaner.
The other levers are unglamorous and they work: submit charges daily instead of in batches, verify eligibility before the visit, and give someone clear ownership of the 90-plus bucket with time actually blocked to work it.
If you do not know your practice's days in A/R off the top of your head, that is the place to start. Pull the number, break it into aging buckets, and see where the dollars are actually stuck. If the shape looks wrong, reach out to the team and we can help you trace it back to the stage where the leak begins.
Sources
- Medical Group Management Association. 2024 DataDive Cost and Revenue Report. MGMA, 2024.
- Healthcare Financial Management Association. MAP Keys: Revenue Cycle Performance Metrics. HFMA, 2024.
- American Academy of Family Physicians. Managing Accounts Receivable in the Medical Practice. AAFP, 2023.
- Centers for Medicare & Medicaid Services. Medicare Claims Processing Manual: Timely Filing. CMS, 2024.
About the Author

Ghulam Shah
Chief Technology Officer
AI architect and data strategist at Sovereign RCM. Ghulam has built enterprise data platforms at scale, led ML forecasting models, and turns complex AI into production-grade products.